
Hey there!
Sršen asked me to analyze smart device usage data in order to gain insight into how consumers use non-Bellabeat smart devices. She then wanted me to select one Bellabeat product to apply these insights to in my presentation. I choose Time. Time is a wellness watch combines the timeless look of a classic timepiece with smart technology to track user
activity, sleep, and stress. The Time watch connects to the Bellabeat app to provide users with insights into their daily wellness.
This case study will answer three key questions.
1. What are some trends in smart device usage?
2. How could these trends apply to Bellabeat customers?
3. How could these trends help influence Bellabeat marketing strategy?
I will detail all those answers but first let me share with you a little information about the data and the process I used to answer the questions above.
The dataset Fitbit Fitness Tracker Data is from a credible open-source data platform Kaggle. The data was gathered from respondents to a survey distributed by Amazon Mechanical Turk. The data was collected in 2016 from 30 Fitbit users who consented to the sharing of their personal tracker data, which included minute-level output for physical activity, heart rate, and sleep monitoring.
The data is in a long format. It was scanned for duplicates and nil values. I found two columns that held the same value and similar names. “Tracker Distance” and “Total Distance” I decided to use “Total Distance” and deleted the “Tracker Distance” column. I calculated the averages for total steps, total minutes active, and total calories. Excel was used to clean and organize the worksheets. The cleaned worksheets were uploaded to Tableau.
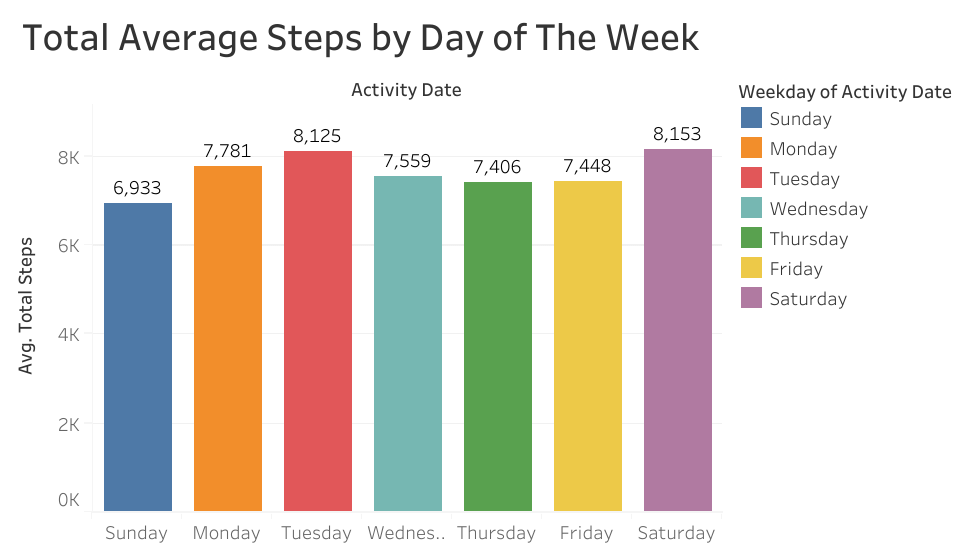
The data shows the average steps taken by day of the week. We can clearly see that the highest average steps taken took place on Saturdays followed closely by Tuesdays. Knowing when users are most active may confirm or dispel previously recorded data. For example, it may be reasonable to assume that users are most active on the weekend. Our data shows that though users are most active on Saturday’s they are almost as active during the week.
Sales and marketing can use this information to show users how this everyday use product can benefit their daily lives even during the week.

The chart above shows the total distance traveled by users by day of the week. The unit of measure is not defined for the distance however, this chart is being used to verify the previous data trends in the Total Average Steps by Day of The Week Chart. We can see that the most distance traveled was on Saturday, followed by Tuesday. This is consistent with the finding that the most steps were also taken on these days.
So lets answer the questions above.
1. What are some trends in smart device usage? The health smart devices are used to measure, activity, calories, and sleep. Users get, on average, more than 6,500 steps per day peaking at 8,153 on Saturdays and getting as low as 6,933 on Sundays. It was interesting to find that users are almost as active during the week as they are on the weekend.
2. How could these trends apply to Bellabeat customers? Bellabeat can use this information to highlight the movement tracking features of their Time wellness watch.
3. How could these trends help influence Bellabeat marketing strategy? Presenting new buyers with the idea that fitness can be a part of their everyday life. Highlighting the facts such users on average having more than 6,500 steps per day. A potential marketing campaign can be.
Every step counts. Every step you take is a step in the right direction. Most users take over 6,000 steps a day.
Conclusion
It would be interesting to see if the pandemic has impacted these trends and how. Updated data would provide stronger marketing strategies. Researching supporting data such as movement trends before using a fitness tracking device and comparing them to movement while using a fitness tracking device would be helpful.

About Me
Hi, I’m LeeAnah James. I am an author, speaker, trainer, and homeschool mom (pre-pandemic and on purpose). I’ve always had a knack for gathering information and creating strategies to meet the end goal so data analytics allows me to read the data and tell its story. I love to connect to other data professionals. You can find me on LinkedIn https://www.linkedin.com/in/leeanah/
